Where is my memory
At the Observatory of Geneva, one of the projects I work on is a re-implementation of a well known software used by astrophysicist: SExtractor.
This software, crudely speaking, detects astronomical sources (from this comes its name: Source Extractor), and makes various measures over the image: photometry, radius, etc. It can do other very interesting things, like fitting models using multiple images at once, but that’s beyond the point.
After introducing some changes to the code, I measured the execution time over an image with a size of 19000 x 19000 pixels, which takes roughly 1.5 GB of space (since each pixel is a 4 byte float).
The software not only uses this image, but it also needs to use others, like a model of the background noise. The total memory used is a multiple of the original image, really.
To be able to process “big” images like this, there is a tile manager that makes sure only a subset is really on memory. The tile memory has a configurable upper limit, and it will evict old tiles when a new one is needed, re-reading, or re-processing the corresponding tile.
This software also can do measures using multiple threads. The detection is single threaded, since the algorithm scans the image line by line identifying sources.
So, not only do I need to measure single threaded, but also multi-threaded.
I went ahead and generated plots single threaded, and running with four threads.
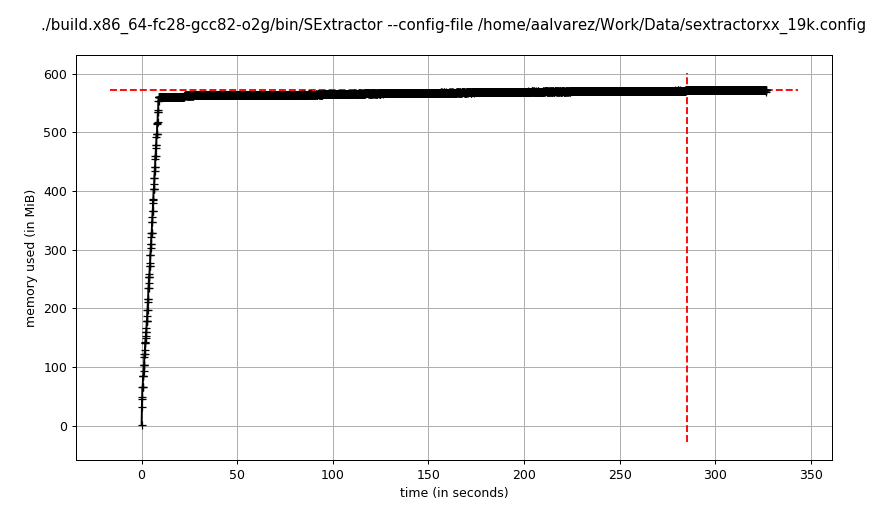
The tile manager is surely doing a good job.
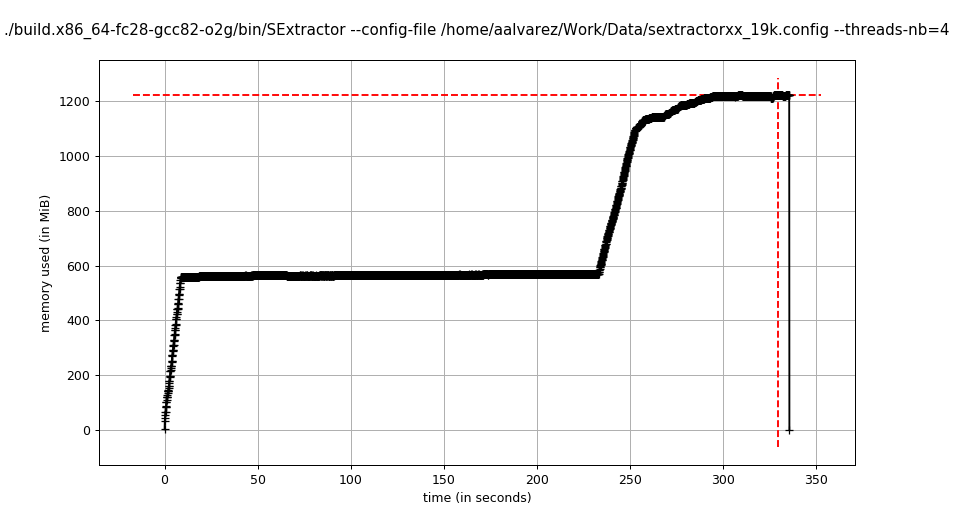
There are two things that stand out when comparing this two plots:
- Multithreaded is not faster - might be because most of the time is spent on detection (?)
- Multithreaded memory consumption has a bump that roughly doubles the amount used
Bear in mind that I had compiled previously this code with both address and thread sanitizers. There are no important leaks, and the program is thread safe.
Next thing I did was to run with kind-of-multithreaded: one thread for detection, and one for measurements.
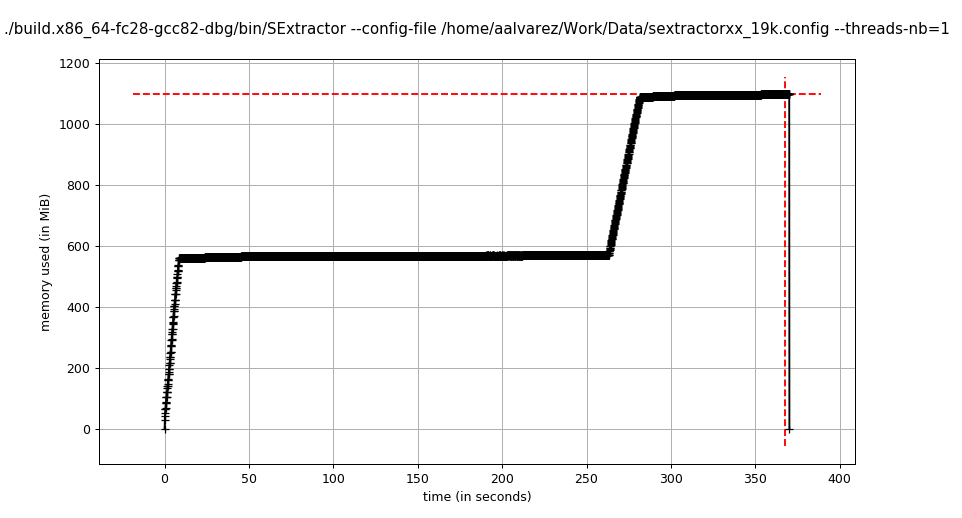
Very similar result. I tried with different number of threads (2, 4, 6), and they all show a bump whose size does not correlate with the number of threads.
Another thing I tried was to change the maximum memory allowed for the tile manager.
Well, it stills doubles, so goes from 2 to 4. Not really surprised, since it was already too on the nose that it was doubling the limit.
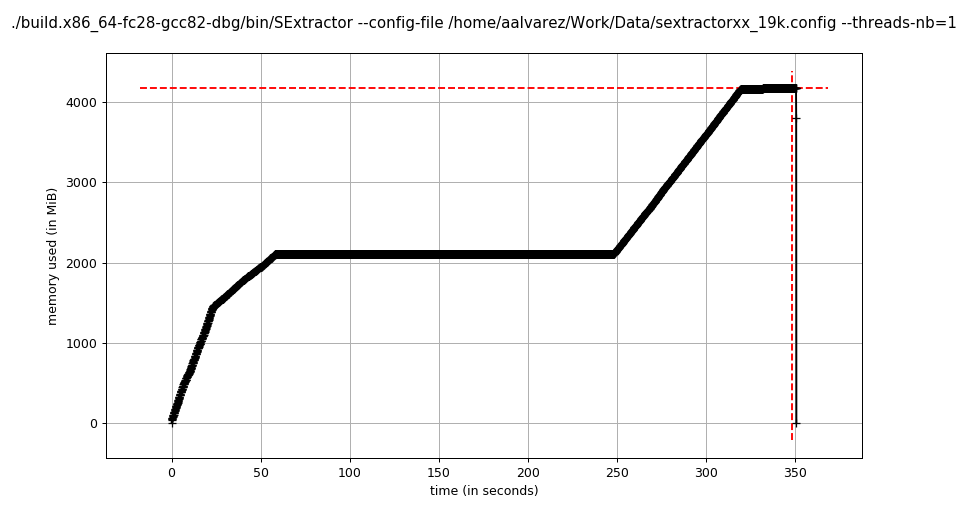
Let’s go crazy. 5 GiB.
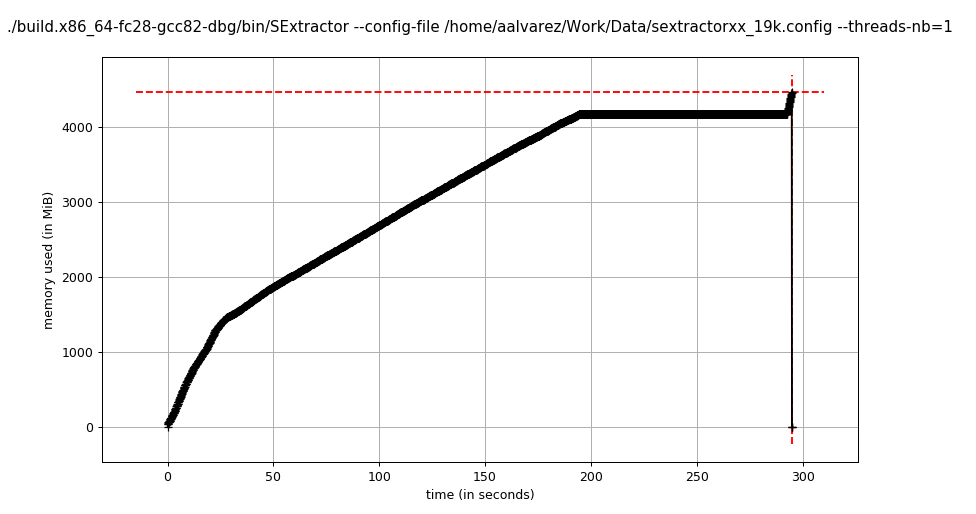
Huh… No bump. It remains steady at around 4 GiB. Probably at this point the tile manager has enough space to keep everything into memory, and then it does not double anymore.
It is worth noting that the small peak at the end is likely caused by the generation of the output catalog.
Next thing I did was to profile more in detail the heap allocations, using heaptrack, a very useful tool.
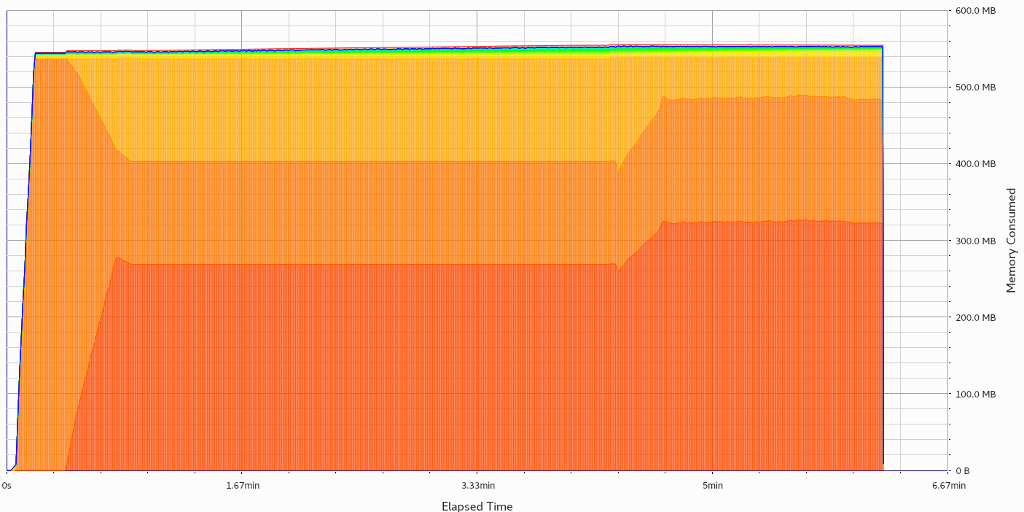
So the memory consumed on the heap, for the execution limiting the memory for the tiles to 512 MiB is, well… what I would be expecting, even better.
Could this be a case of memory fragmentation?